“A phase angle meter is useful in audio work to determine the phase angle between a reference signal and a phase shifted signal, both having identical time periods. Typical uses include: Finding the phase angle between voltage and current to determine the phase shift and impedance of a loudspeaker over its frequency range. Finding the phase shift between the input and output of a tube amplifier to establish the HF (high frequency) and LF (low frequency) cutoff points needed to avoid instability in feedback amplifiers.”
In addition to these, there are other uses — for example, measuring the phase shift through any active or passive filter which includes equalization networks.
In his design, he chose a set of five calibrations frequencies: 10 Hz, 100 Hz, 1000 Hz, 10 kHz, and 100 kHz. He relied on an external oscillator to drive the calibrator at these input frequencies. I first built the calibrator as described, and then I made some modifications that better suited my needs. But first I will describe how the calibrator works. I think it’s best to just provide a bit more from Hansen’s article:
“The Phase Angle Calibrator makes use of an op amp filter circuit called the all-pass circuit, which takes a sine-wave input and produces a constant amplitude phase-shifted sine wave output. The lag output version was used in Fig. 1. The theory behind the all-pass filter is available in many reference books and texts, but I found one by Walt Jung [1] that I believe is the easiest for a novice to understand. The phase shift angle is varied by the parallel combination of R3 and R9 through R19 with C3 through C7 in accordance with the formula:
? = -2 arctan (2?RC)
where ? is the phase angle, and f is the frequency. After selecting a suitable value for C, you can solve for R by rearranging the formula:
R = tan(-?/2) / 2?fC
This is hardly a linear relationship. Large changes in resistor value produce very little change in phase angle as you approach 0 or 180 degrees. It’s much easier to apply the input signal to both inputs of the phase angle meter for zero degrees, and use an op-amp inverter to generate the 180 degree signal.”
Modify The Calibrator
I added an internal Wein-bridge oscillator to simplify using the calibrator and I changed the set of frequencies to cover just the audio range: 20 Hz, 100 Hz, 1000 Hz, 10 kHz, and 20 kHz. (This range is also easier to cover with a single-range oscillator, the capacitor values stay reasonable.) The actual frequencies, shown in Table 1, vary somewhat from the ideal frequencies because I used standard 1% resistors and 5% capacitors.

Selecting and matching the capacitors would give closer results, but it’s more important to know what the frequencies are. Because I had already built a circuit board for the calibrator circuit, I used a second circuit board for the oscillator. Figure 1 and Figure 2 are the two circuit diagrams.


Tables 2 and Table 3 are the parts lists. Please note that the calibrator circuit is unchanged from Hansen’s design, except for the values of the capacitors C3 and C7. In the original, C3 was 470 nF (for 10 Hz) and C7 was 47 pF (for 100 kHz). I put both circuit boards and a ±15-VDC power supply (any regulated supply will suffice) in a Wolgram MC-9 enclosure.


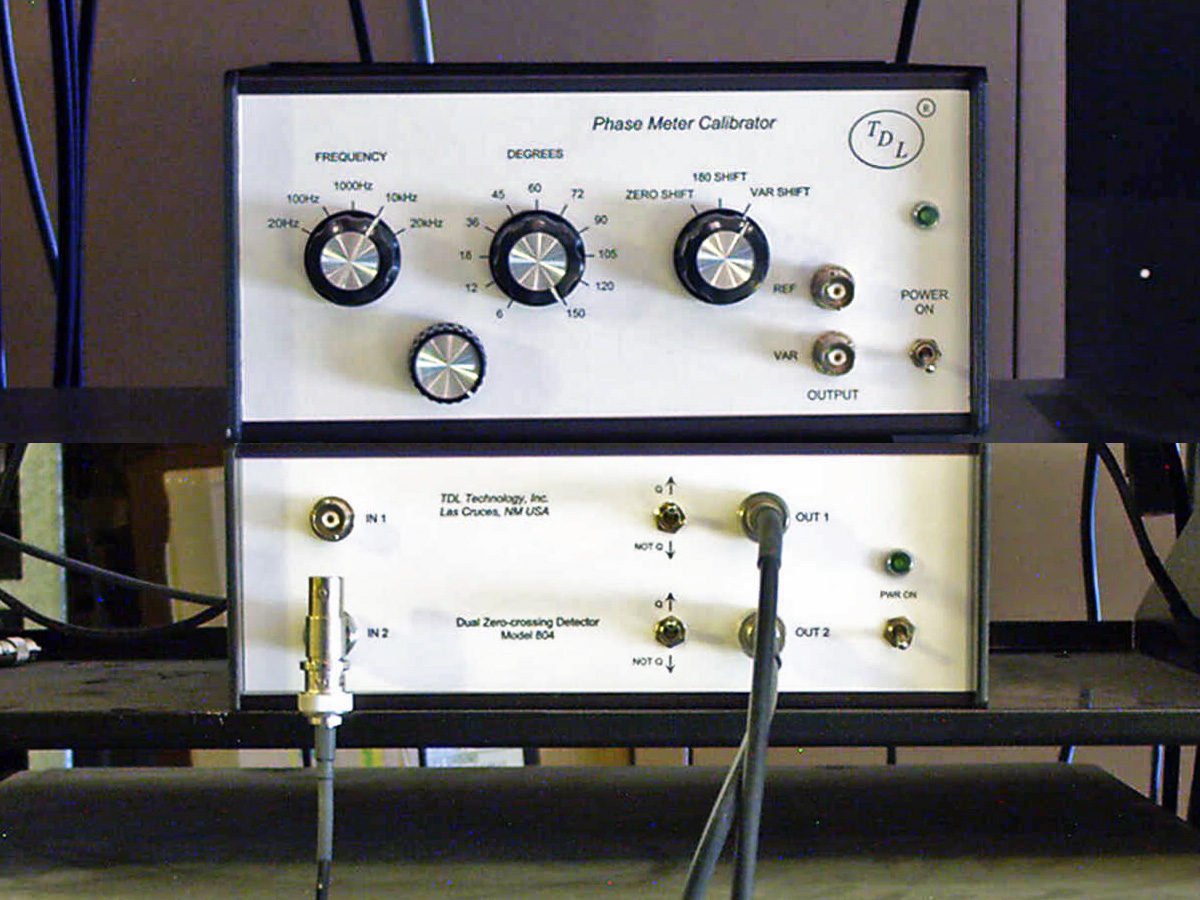
The completed calibrator is shown in Photo 1 with a Dranetz Phase meter. (More about this later.) The unlabeled knob, lower left in the photo, is an oscillator output level control (R8 in Figure 2), which I added after making the front panel label.

Wein-bridge oscillator theory is discussed in many textbooks and is rather mathematical. I will describe it as simply as possible. In Figure 2 the oscillation frequency is set by the value of R and C connected between the op-amp non-inverting input (pin 3), the op-amp output (pin 6), and common. For a frequency of 1,000 Hz, C = 22 nF (C3 and C10) and R = 7235 O (the series combination of R1 + R2 and R3 + R4). The equation is:
f = 1/(2?RC) = 1/(2?(22 x 10-9) (7235)) = 1000 Hz
For amplitude-stable oscillation to occur, the gain of the op-amp circuit must be 1/3. This is set by the impedance of the RC network and resistors R5, R6 and R7 and the incandescent lamp. The lamp is important because it stabilizes the gain at 1/3. If the output voltage (pin 6) tries to increase, the lamp’s resistance decreases and the output voltage decreases. This works very well, but it takes the output amplitude a small of amount of time to stabilize, especially at low frequencies. The CM6833 lamp is very small, so its thermal time constant is very low and stability happens very quickly. The trimmer pot, R6, is adjusted for minimum distortion in the output signal. You can get rather close by looking at the waveform with a scope, but it’s better to use a distortion analyzer or spectrum analyzer. Spectrum analysis software on a PC is fine, just adjust R6 to minimize the height of the sidebands or use a program that directly displays harmonic distortion.
At 1000 Hz, TrueRTA shows the second harmonic (2000 Hz) down 80 dB (0.01% distortion) with the higher harmonics even lower. AudioTester shows a total harmonic distortion of 0.0105% using the first ten harmonics.
TrueRTA is a spectrum analysis program available from True Audio. Demo versions and a free version (level 1) are available on its website. AudioTester is another spectrum analysis program.
Test The Calibrator
The calibrator should be reasonably accurate when built using the 1% resistors and 5% capacitors in the parts list. But as with any other piece of test equipment, it would be satisfying to make some measurements to be sure. I will describe two methods that I used: all the measured values are presented in Table 1. As you can see, the calibrator is very satisfactory.
One method is to use a calibrated phase meter with an accuracy better than the calibrator. I used a Dranetz model 305 (five-digit phase angle display) with a model 305-PA-3007 plug-in.(The Dranetz phase meter is no longer manufactured but used units may be found on eBay or from used electronic instrument dealers.) This plug-in provides automatic operation for input amplitudes of 50 mV RMS to 50 V RMS and frequencies from 2 Hz to 70 kHz. Automatic operation means there are no operating controls. The plug-in scales the input voltage to the mainframe and provides the correct frequency compensation.
Another method is to use a time interval counter to measure the time between an amplitude zero crossing of the reference signal to the amplitude zero crossing of the phase shifted signal. Phase shift can be calculated from the time interval as:
? = 360tf/1000
where ? is the phase shift in degrees, time delay t is in milliseconds, and f is the frequency in hertz.
I used a Hewlett-Packard (HP) model 5245L frequency counter with a model 5262A time interval unit plug-in (see Photo 2).

The 10-MHz counter timebase gives a time resolution of 0.1 ms. The time interval plug-in has trigger-level controls for each channel but they are not calibrated and can’t accurately set the zero crossing with a sine wave input. The smaller “box” above the counter in the photo is a two-channel zero crossing detector. I designed and built this detector to output a pulse whose leading edge coincides in time with the input zero crossing. The counter measures the time between the leading edges of the two pulses: the reference and the phase shifted signal. The detector circuit diagram (see Figure 3) and parts list (see Table 4) are included. I packaged the Detector circuit board with a simple ±5-V regulated power supply in a Wolgram MC-7A enclosure.


Looking at one of the detector’s channels in Figure 3, U1 is an input buffer. Resistors R5, R6, and D1 clip the negative-going half of the input sine wave. The comparator circuit (U2) outputs a very short pulse at the input zero crossing. This pulse is “stretched” by the monostable multivibrator in U3 to about 12 ms as set by the time-constant of C1 and R19. Two front panel toggle switches select either the positive-going or negative-going output pulses. The reference and shifted pulses — 45° at 10 kHz — are shown in Photo 3.

Finding A Phase Meter
New phase meters are expensive but used models can sometimes be found on eBay or from used electronic test equipment dealers, just try a Google search. In addition to the Dranetz 305 (which I found on eBay), other useful models include:
Aerometrics model PM720 phase meter, 5 Hz to 500 kHz, analog meter display. Aerometrics denies any association with this unit but it is often listed under this name.
Hewlett-Packard model 3575A gain-phase meter, 1 Hz to 13 MHz, four-digit display Wavetek model 750 phase meter, 10 Hz to 2 MHz, four-digit display In addition, you can find application notes and magazine articles that describe how to build your own phase meter. These are usually fairly simple designs. The following appear to be useful: Intersil Application Note AN9637 (This is identical to Design Idea #1890 that was published in the July 4, 1996 issue of EDN); Elliott Sound Products Project 135; and Salvati, M. J., “Phase Meter Profits From Improvements,” Design Idea, Electronic Design magazine, April 11, 1991.
Tailor The Design
I sent a copy of this article to Hansen for comments. He agreed that having the oscillator built-in is a good feature. He also commented as follows:
“A problem with my phase meter calibrator design is that the distortion increases with phase shift, and the amplitude drops as well. It might be possible that the zero-crossing detector might be fooled by the higher order distortion harmonics. I’d be interested in what you find out in this regard.”
So, I measured the amplitude drop and distortion at 150°, which should be worst case. I set the 20-Hz variable output to an arbitrary 2.00 V. Keeping the output level control unchanged, I measured what you see in Table 5. This amount of drop seems acceptable.

I used a Hewlett-Packard model 3581A wave analyzer to measure the harmonics. Refer to Table 6. These numbers look acceptable and the zero-crossing detector output at 20 kHz and 150 degrees measures 22 ms on an oscilloscope with a calculated 21.5 ms at the actual frequency of 19.61 kHz.

I am very satisfied that the calibrator is suitable to troubleshoot and calibrate any phase meter you are likely to find, either new or used. Without overdoing the math, there is enough design information here to allow you to tailor the design to a specific frequency range, keeping in mind the 1000:1 practical frequency range of the Wein-bridge oscillator, without using range switching.
The circuit board designs listed in the parts lists are available in CIRCAD format and are posted on the TDL website. (CIRCAD is a circuit board design program available from Holophase. The boards in the pmcalpcb.zip file were designed with Version 4, a free download of which is available on the Holophase website.) The physical boards are not available.
Ron Tipton lives in Las Cruces, NM. Visit the TDL Technology website for more information about his audio designs and services.
Reference
[1] Jung, W. and Sams, H., Audio IC Op-Amp Applications, 2nd Edition, Sams Publishing, 1978.


