This Test Bench is dedicated to the Beston RT002A ribbon tweeter. Beston Technology was founded in 2002 in Taipei, Taiwan. Since its inception, Beston has focused on high-frequency ribbon devices using a Kapton substrate. The first transducer Beston sent to Voice Coil’s Test Bench column was the RT002a ribbon tweeter.

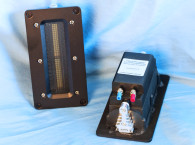
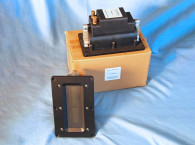
The Beston RT002A is a closed-back ribbon tweeter with a 10-mm × 50-mm aperture (see Photo 1). Features include a thin laminated aluminum diaphragm, an injection-molded faceplate, a stamped metal chassis, a neodymium (Nd-Fe-B) magnet, a 40-W rated power handling (third-order 2.5-kHz network), and a pair of solderable terminals.
I began analysis for the RT002A by performing a 300-point impedance curve (see Figure 1). Like most ribbon devices, this device exhibits only a slightly defined resonance at 849 Hz (5.5 Ω); however, the impedance is nearly equal to the DCR, which for the RT002A measured 5.3 Ω.
Next, I mounted the RT002A in an enclosure with a 6” × 12” baffle area and measured the on- and off-axis SPL. The LMS analyzer was set up to produce a 100-point 2.83-V/1-m gated sine wave sweep from 1 to 40 kHz. (Normally, I set a 300-Hz-to-40-kHz range, but the RT002A was sounding stressed below 500 Hz, which is not uncommon for a small diaphragm tweeter such as this one.)


I took data in both the horizontal and vertical planes with sweeps at 0°, 15°, 30°, and 45°. Figure 2 shows the Beston RT002A’s on-axis response. While the factory literature claims a 92-dB 1-W/1-m sensitivity, the SPL in the operating range varied from 92 to 98 dB. The RT002A’s frequency response is ±3 dB from 1.9 to 21 kHz with output to nearly 40 kHz.
Figure 3 shows the on- and off-axis frequency response in the horizontal plane, which is excellent. Since the aspect ratio of the RT002A’s aperture is pretty extreme (as are many ribbon transducers), there is substantial directivity in the vertical plane (see Figure 4). The two-sample SPL comparison is shown in Figure 5, indicating that the deviation between the two samples was less than 1 dB from 3 to 10 kHz, with some deviation above and below those frequencies.
For the final measurements, I set up the Listen SoundCheck analyzer with the SCM microphone and SoundConnect preamp/power supply (courtesy of Listen). I used the built-in pink noise generator and SLM utilities to set the SPL 94 dB/1 m (0.85 V). I relocated the 0.25” SCM microphone to 10 cm from the Beston RT002A’s faceplate and ran the distortion curves (see Figure 6).
Note that the stimulus was limited to 2 kHz as its lowest frequency. For the final measurement on the Beston ribbon tweeter, I performed an impulse measurement, then imported the data into the Listen SoundMap software, windowed out the room reflections, and created the cumulative spectral decay plot (CSD) shown in Figure 7. The STFT is shown in Figure 8.
www.ribbonspeaker.com.tw


This article was originally published in Voice Coil, April 2013.


