“I Can Hear It. Why Can’t I Measure It?” is the title of an excellent article written by Dan Foley from Audio Precision for audioXpress Focus on Test & Measurement Special issue, March 2016. Dan Foley discusses how audible distortion can be difficult to measure and explores the instrumentation noise floor’s impact on what can be measured. As he explains, instrumentation noise floor is an overlooked contributor for the reason we are not able to measure a particular audible “distortion,” especially with low sound pressure level (SPL) signals.
In many cases, the reason given as to why a particular audible “distortion” cannot be measured is that the measurement equipment doesn’t have sufficient signal processing capabilities, such as measurement bandwidth or Fast Fourier Transform (FFT) resolution. In this article, we will explore an overlooked contributor — the instrumentation noise floor, which can have a significant impact on what can be measured, especially with low sound pressure level (SPL) signals.
Prior to headphones and insert earphones (earbuds) becoming the common way to listen to music, background noise from household appliances or heating and air conditioning fans in a typical listening environment could potentially mask playback system distortion, such as higher order harmonics of AC line hum or switching amplifier intermodulation distortion (IMD).
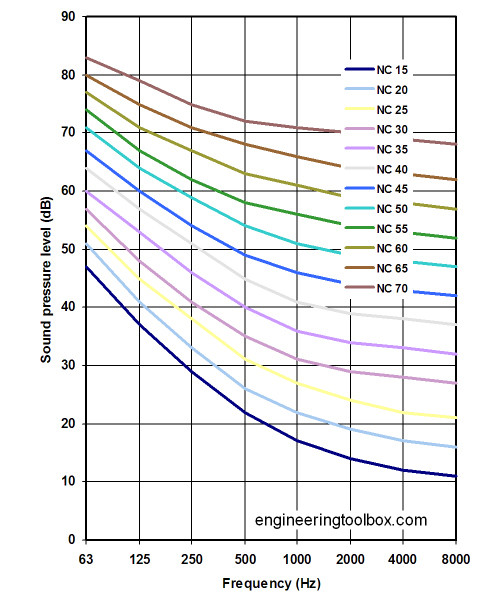

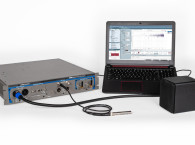
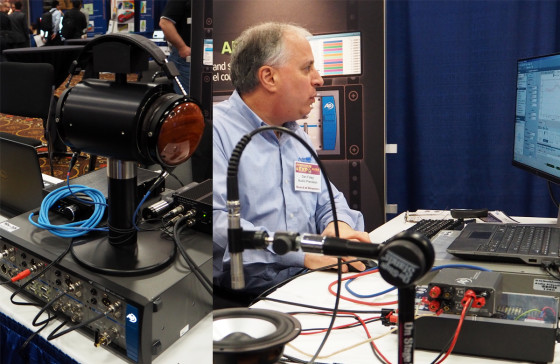
Typical suburban homes have background noise levels of 30 to 38 dBA, with a noise spectrum corresponding to the Noise Criterion (NC) 30 curve (see Figure 1). Apartment noise levels are even higher.higher. To confirm this, I measured the background noise in my living room and positioned a G.R.A.S. 0.5” microphone (Model 46AE) on a tripod at ear height, and used an Audio Precision APx515 analyzer to measure the corresponding background noise, using a 64k FFT with eight linear averages. The APx Octave Band Utility was used to synthesize an octave-band spectrum. The overall sound pressure level was 38 dBA and the measured ambient noise spectrum just exceeds the NC-30 noise criterion curve by about 1 dB (see Figure 2).
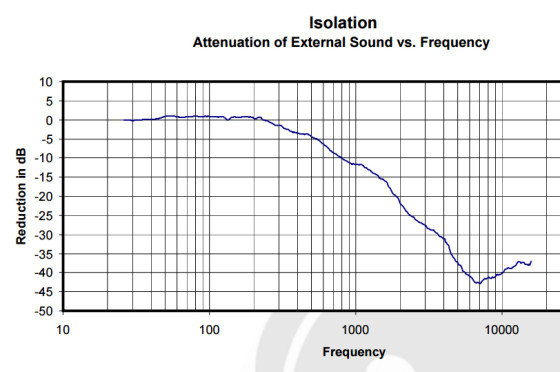
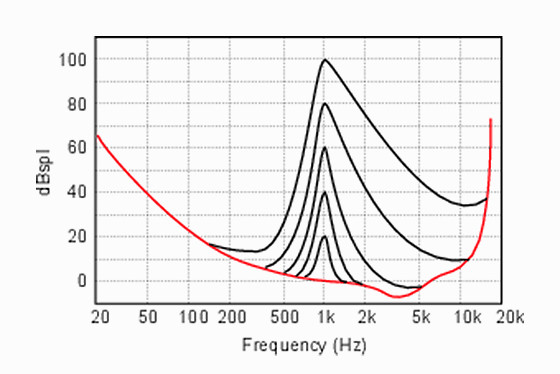
However when one listens to music using circumaural headphones or insert earphones, the listening environment background can be attenuated by 20 dB or more, dramatically reducing the masking that was present due to background noise (see Figure 3). As a result, the listener’s perception during very quiet passages more closely follows the threshold of the hearing curve, shown as a red line in Figure 4, bringing sensitivity to a sound pressure level (SPL) below 0 dB (20 micropascals). From a headphone/headphone preamplifier system perspective, this means that distortion artifacts could be as low as 0 dBSPL and still be audible.

Impact On Measurements
So how does all of this impact measurements?
Every part of the measurement signal path introduces noise, beginning with the microphone capsule and its corresponding preamplifier. The IEC 711 couplers that are used in Head-and-Torso Simulators (HATS) test manikins and equivalent products typically incorporate a 0.5” microphone with a 12.5 mV/Pa sensitivity or −38 dB referenced to 1 pascal.
Given that 1 pascal is equivalent to 94 dBSPL, the lowest SPL one can potentially hear around 3.2 kHz is −5 dBSPL. At 94 dBSPL the voltage from the microphone is 12.5 mV. At −5 dBSPL, the voltage level will be 99 dB below this value, which is 141 nanovolts!
Instrumentation noise should be 10 dB below the level one wants to measure. In this case, the noise level in this frequency range would need to be 47 nanovolts, but it does not mean the instrumentation noise floor over the entire audio band needs to be 47 nanovolts. But, the lower the noise floor is from 20 Hz to 20 kHz, the better you can measure these extremely low voltages.
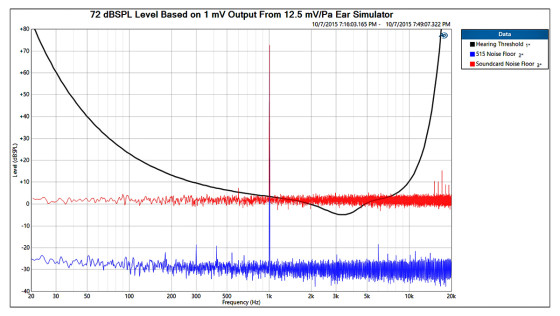
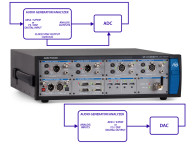
Figure 5 shows how the instrumentation noise floor can mask the presence of audible signals in the 2-to-5-kHz range. Two pieces of test equipment are compared: the Audio Precision APx515 analyzer and a high-end sound card representative of those often recommended as a data acquisition front-end.
The measurements were obtained using the Audio Precision APx555’s analog generator, which has typical THD+N of −120 dB or better from 20 Hz to 20 kHz. A 1 mVRMS sine wave at 1 kHz was used as the stimulus for both the ADC of the APx515 and the sound card interface. A 1 mV level was chosen because it represents 72 dBSPL when using a 12.5 mV/Pa microphone. For both the APx515 and the sound card interface, 20 linearly averaged 64k FFTs were used to generate the noise-floor spectrum.
The black curve represents the threshold of hearing. The red curve shows the noise floor of the sound card. The blue curve is that of the APx515. It can be clearly seen that when using the sound card interface, sound energy that is audible in the 2-to-5-kHz region may not be measurable. One can increase the FFT buffer size, which in turn will reduce the noise energy in each FFT bin, but this will increase test time.
Results
The ear - especially when little or no acoustic masking is present - is an extremely sensitive “microphone.” Distortion artifacts, such as intermodulation distortion (IMD) and/or pulsating noises (e.g., GSM interference) may be audible even though the actual sound pressure is below 0 dBSPL. Unless the test equipment (in particular the analyzer front-end) has a very low noise floor, there is a risk of not being able to objectively quantify (or develop a proper engineering solution for) distortion that is clearly audible in earphones.
References
[1] “Noise Criterion,” The Engineering ToolBox,
www.engineeringtoolbox.com/nc-noisecriterion-d_725.html.
[2] Audeze LCD-XC Headphone Measurements, Inner|Fidelity, www.innerfidelity.com/images/AudezeLCDXC.pdf.
[3] Shure SE535 Headphone Measurements, Inner|Fidelity,
ww.innerfidelity.com/images/ShureSE535.pdf.
[4] G. Martin, Introduction to Sound Recording, 2011, www.tonmeister.ca/main/textbook/intro_to_sound_recordingch6.html.
Sources
APx515 analyzer Audio Precision | www.ap.com
Model 46AE 0.5” microphone G.R.A.S. Sound & Vibration A/S | www.gras.dk
About the Author
Dan Foley has been with Audio Precision since the middle of 2011. He is an experienced sales engineer with a background that includes 12 years as a sales engineer and US Manager of the Environmental Noise Group for Brüel & Kjær, six years as VP of Sales at Listen, Inc., and five years at Bose Corp. He is an expert in the field of acoustics and has extensive experience with audio-related standards committees, including those associated with the The Institute of Electrical and Electronics Engineers (IEEE), the Audio Engineering Society (AES), and Bluetooth Special Interest Group (SIG) organizations.