While each of these audio analyzers has its pros and cons, finding an analyzer that does everything needed to measure speakers and electronics and has a relatively short learning curve is high on my wish list. Certainly several analyzers on the market fulfill this criteria. However, there is a learning curve associated with any piece of test equipment — all of them being complex devices with a plethora of features. But, after years of using this type of equipment, I know what I want when it comes to testing a speaker or piece of electronics. It needs to be intuitive enough that I don’t have to constantly relearn how to use the test equipment or have to pull out the user’s manual to get my work done. “Intuitive” is the magic word when it comes to test equipment. The Woofer Tester 2, Speaker Tester, and Woofer Tester Pro products from Smith & Larson Audio are the types of products that have a relatively short learning curve, yet are capable of handling any type of speaker measurement at an affordable price.
Company History
Smith & Larson Audio is a partnership between two engineers, Brian Smith and Keith Larson. Smith is the founder and CEO. He has over 20 years of experience with audio and digital signal processing (DSP), with over 10 of those years working in the technical sales division of Texas Instruments. Keith Larson is the chief technical officer. He joined Texas Instruments as a senior DSP applications engineer, where he met Smith and discovered their mutual interest in audio. Larson joined Smith, to form Smith & Larson Audio in 2004, where he began applying his digital signal processing knowledge and lifelong passion for speaker building. Over the years, Larson has devised new techniques for measuring and modeling driver parameters, added a real-time crossover simulation routine, and developed a method for modeling AC and DC compression effects with Woofer Tester Pro.
The Smith & Larson Analyzer Family
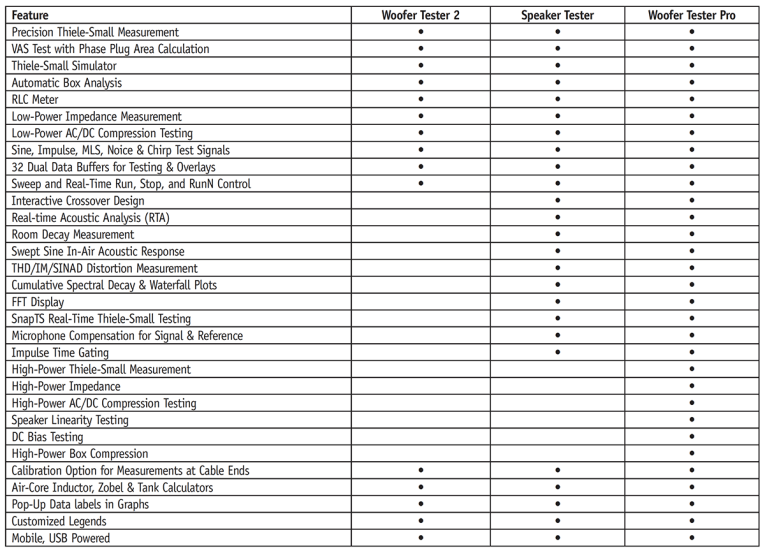
As I mentioned, S & L produces three products for loudspeaker analysis, the Woofer Tester 2, Speaker Tester, and the Woofer Tester Pro. Table 1 gives a convenient feature comparison chart for all three analyzers. As is immediately obvious, each model offers progressively more advanced features with an upgrade path between each of the models, except for the Woofer Tester Pro, which is the flagship model.
The Woofer Tester 2
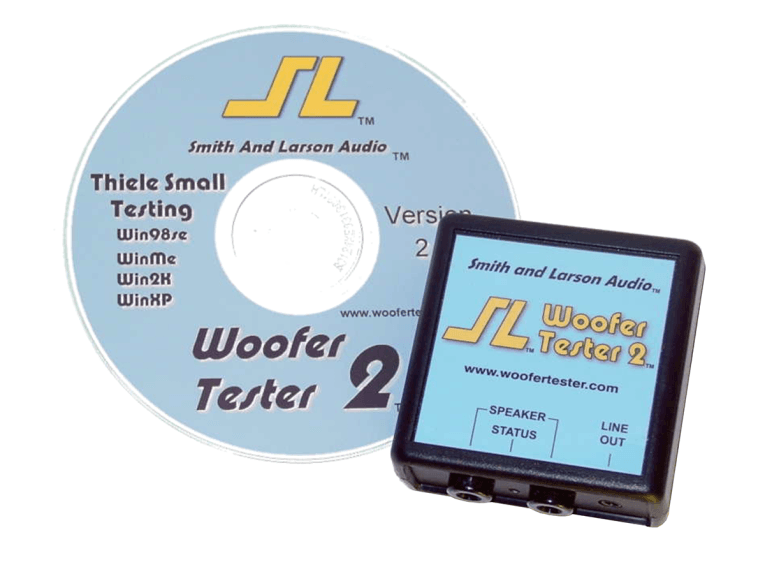
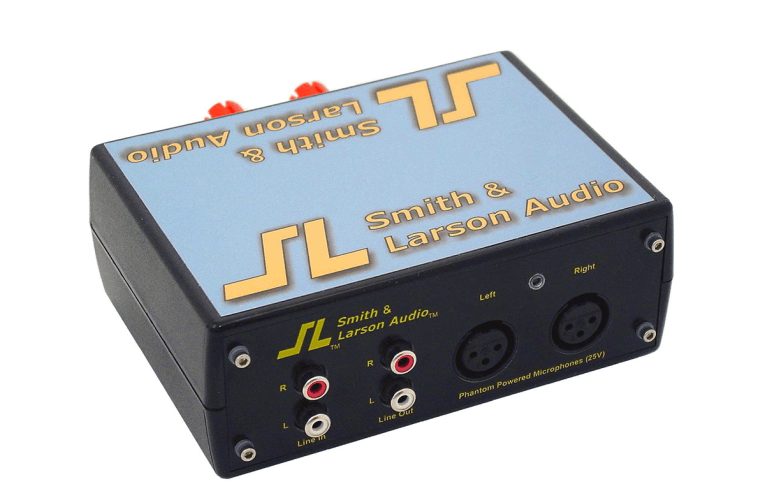
The Woofer Test 2 is S & L’s basic speaker analysis model (see Photo 1) and like the Speaker Tester and Woofer Test Pro, it can be powered by either the USB connection or an outboard 5-V power supply. The unit is quite compact and measures 2.6" × 2.6" × 1.1" and the WT2 ships with the following:
• A test unit
• CD-ROM with software
• 1 USB A/B cable
• 1 Set of test leads
• 1 Banana plug with calibration resistor
• Downloadable user guide
• Free software upgrades and support
The Woofer Tester 2 is used primarily for measuring TS parameters and doing box simulations. However, it is capable of numerous other functions. Measuring a driver’s Thiele-Small parameters is easy with this analyzer. Q/FS, Vas, and motor parameters are measured with a single click of a button. Vas can be measured with the delta mass, delta compliance, or efficiency (using the No and Sd) method. The software’s sophisticated model takes the phase plug area into account as well.
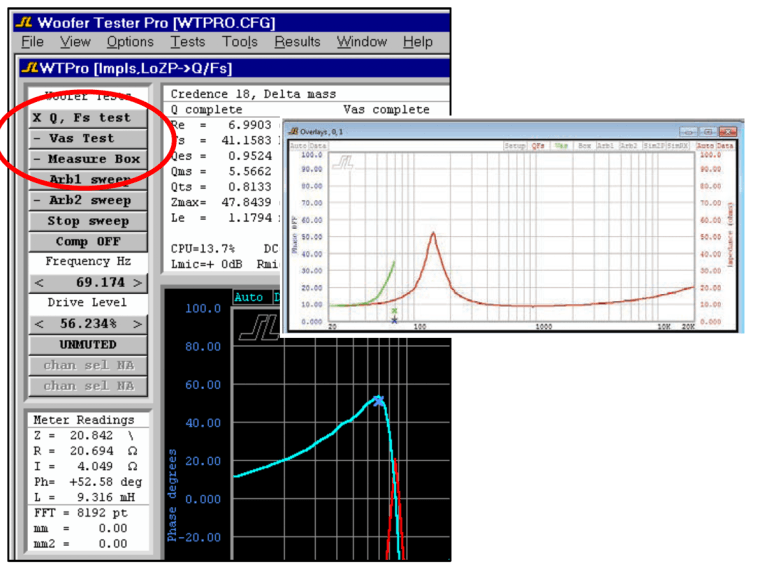
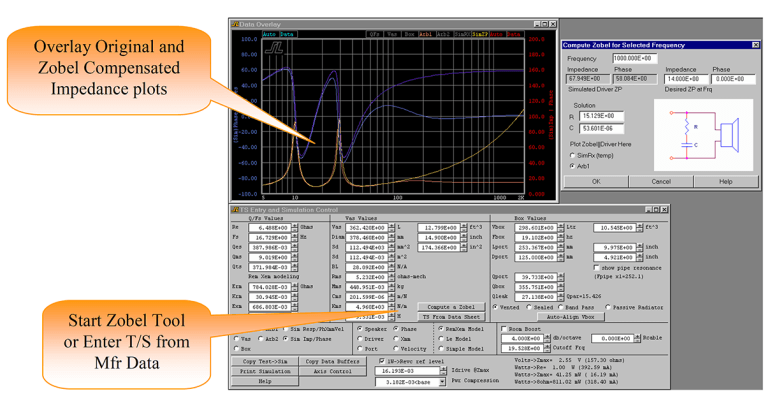
At this point, readers should note that all of the S & L analyzers measure impedance by measuring voltage and current simultaneously, dividing the two curves automatically, and displaying impedance as if it were a constant voltage method, using a large series resistor or the analyzer source impedance. With the Woofer Tester 2, this is done at low-voltage levels with a maximum current of 3 mA. A complete parameters check includes: Re, Rs, Zmax, Qes, Qms, Qts, Le (1 kHz), diameter, Sd, Vas, Bl, Mms, Cms, Kms, Rms, Efficiency, Senstivity (1 W/1 m and 2.83 V), Fs/Fsa, Ideal Mass, Mass Used, Krm, Erm, Kxm, and Erm. See Figure 1 for a graph and partial screen of the impedance measurement control panel.
For high-speed testing, impedance and phase can be accomplished under 1 s, using various impulse, MLS, noise, sine, and chirp test signals that are available in fast mode. This is also useful for a crossover design or a quick, production line test of a driver. Note that this mode is not as precise and is not recommended in a final speaker design. Additionally, the Woofer Tester 2 allows you to see the Cms trend vs. drive level.
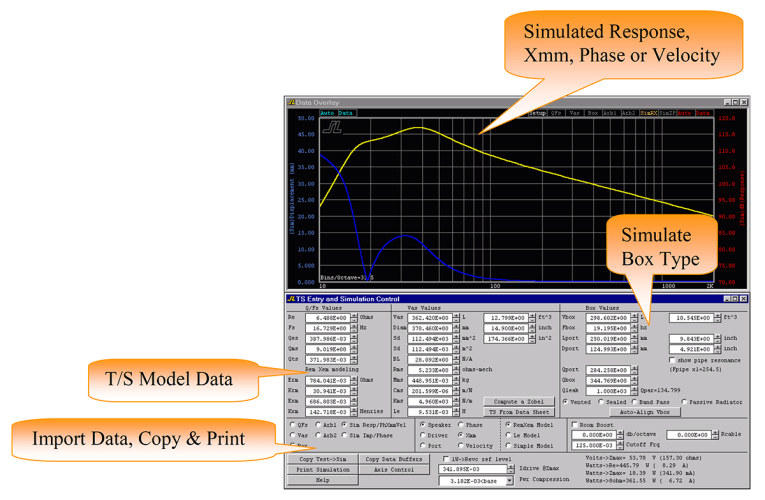
The Woofer Tester 2 includes an Advanced Thiele-Small Simulator and Box Analyzer that models frequency dependent inductance and vastly improves measurement results over existing methods. This simulator models vented, sealed (see Figure 2 for a vented-box example), band-pass and passive radiator designs. Additionally, it calculates box, port, and stuffing losses and measures response, impedance, phase, velocity, and Xmm. Looking at the overlay window illustrated in Figure 3 which compares a measured vented-box impedance with the simulated impedance, you get a “feel” for the accuracy of the Woofer Tester 2 software.
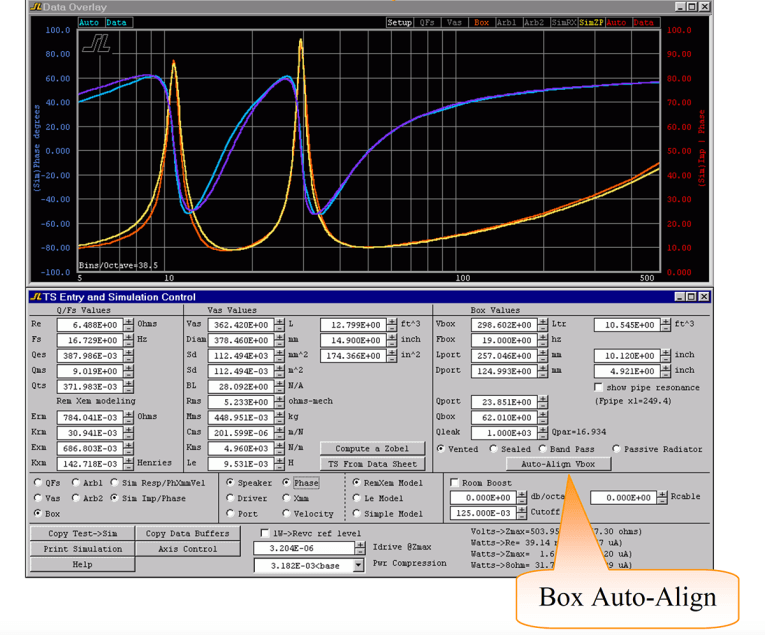
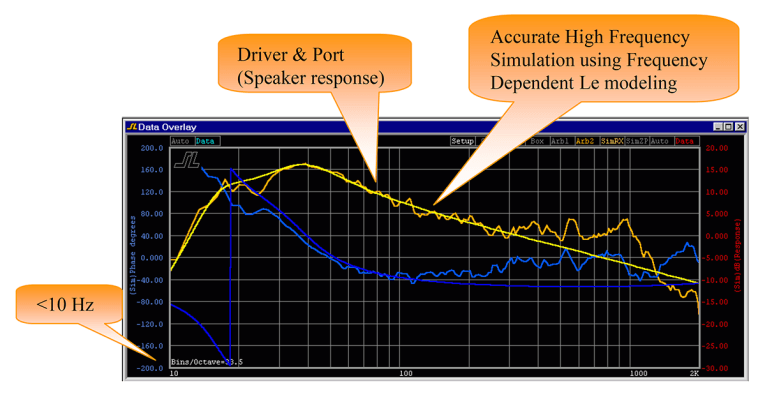
Incidentally, the overlay window has a 32-position buffer that will allow the user to display up to 32 curves simultaneously. Besides impedance, the high-frequency data simulation likewise displays a good degree of magnitude and phase accuracy (see Figure 4.) Note, the Woofer Tester 2 does not measure SPL, so this comparison included a SPL curve from Woofer Tester Pro. The advanced features in the TS Simulator allow you to account for room or car pressure field effects, as well as vent (pipe organ) resonances. Driver compression effects can be selected from the test environment, AC compression measurement table, or a manufacturer’s data sheet.
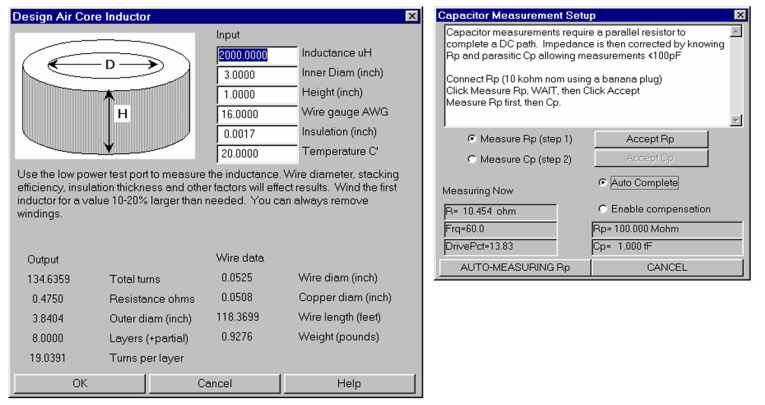
The Woofer Tester 2 also has some very useful utilities giving it the ability to measure crossover components (inductors, capacitors and resistors), design inductors (see Figure 5), zero out cable resistance in measurements, and design impedance conjugates for drivers aka Zobel circuits (see Figure 6). The Woofer Tester 2 is priced at $159.95 and that brings us to the next product in the S & L line up, the Speaker Tester.
Speaker Tester
Speaker Tester has all the same features as Woofer Tester 2 plus the additional list of features shown in Table 1. This includes sweep stop and run controls, an interactive crossover design routine, an RTA mode, room-decay measurements, sine wave acoustic measurements, FFT analysis with cumulative spectral decay plots (“waterfall” graphs), SnapTS real-time TS parameter testing, microphone calibration, and impulse gating. With all these new features, Speaker Tester also comes in a completely different hardware package as can be seen in Photo 2. (Note, this is actually a picture of Woofer Tester Pro, but the package looks nearly identical to the Woofer Test Pro). The S & L Speaker Tester ships with the following:
• The test unit
• CD-ROM with software
• 1 Measurement microphone (Behringer ECM-8000) and Cable
• 1 USB A/B cable
• 2 RCA Y-Cables
• 1 10-Ω, 0.25-W Calibration resistor
• Low-power banana/alligator test leads
• Downloadable user guide
• Free software upgrades and support
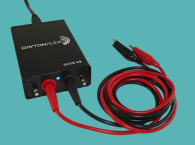
The hardware features for the Speaker Tester include: dual XLR microphone inputs, low-level line input and output RCA jacks, and internal software-controlled source switching. Like the Woofer Tester 2, it can self-powered using a 5-V wall wart or a USB port. The analyzer is compact and measures 6" × 4.25" × 2.25".
The Speaker Tester measures acoustic response with MLS, noise, chirp, continuous sine wave, and pulsed sine wave stimuli. Using MLS, noise or chirp signals the resulting FFT’s can be unwindowed for room response measurement, or the impulse response can be windowed (MLS and step) to produce magnitude and phase semi-anechoic frequency responses, or further processed to produce cumulative spectral decay (waterfall plots) plots such as illustrated in Figure 7. Note that Speaker Tester and Woofer Tester Pro are two-channel analyzers, and as such, all phase measurements are measured not calculated.
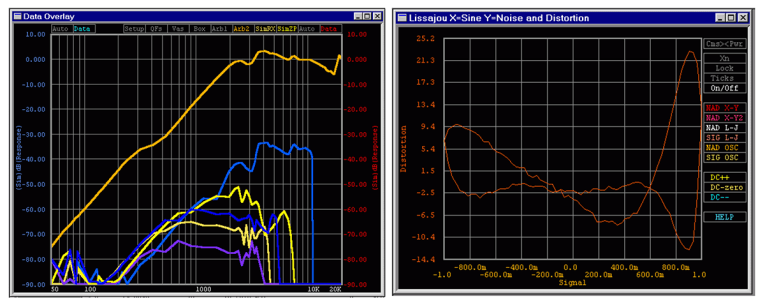
Besides frequency response magnitude and phase, the Speaker Tester is also a distortion analyzer. The Speaker Tester includes 1st through 6th Harmonic, inter-modulation and Signal to Noise and Distortion Radio (SINAD) distortion measurement. In addition to raw data values, THD and IMD data can be plotted by frequency, and SINAD can be viewed using an oscilloscope or Lissajou format (see Figure 8).
Impedance measurements and box design functions are identical to the Woofer Tester 2; however, the Speaker Tester adds an additional high-speed, real-time TS calculator called “SnapTS.” SnapTS would be great for measuring TS parameters in noise-controlled production line environments.
Since Speaker Tester is able to measure frequency response magnitude and phase, S & L has also included an interactive crossover designer that greatly speeds up crossover design time by simulating crossover designs without actually having to build them. Using a node-to-node network list, crossovers can be designed and the stimulus shaped to the network transfer function.
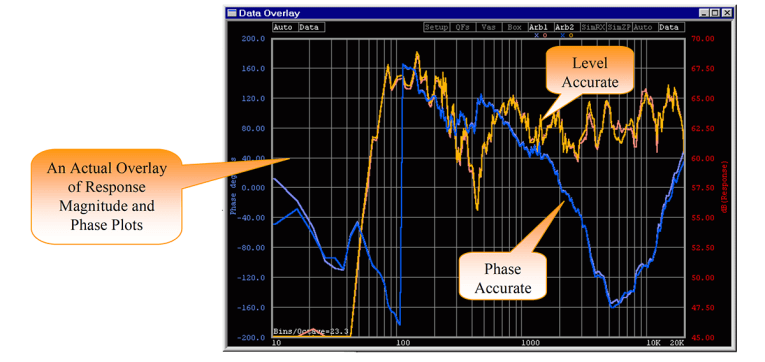
The Interactive Crossover Designer designs are entered via an ICD circuit file, which is then converted into filtered left and right test signals. When these test signals are connected to your drivers, the dB and phase-accurate response is revealed. This also includes an optional software inline tweeter protection circuit.
Another advantage is that ICD is a real-time process. This means you can move the speaker or microphone and continue measuring. The graph displayed in Figure 9 shows the results, accurate to fractions of a dB. Speaker Tester is priced at $649.95 and that brings us to the last analyzer in the Smith & Larson product mix, the Woofer Tester Pro.
The Woofer Tester Pro
The Woofer Tester Pro has all the same features as S & L Woofer Test 2 and Speaker Tester analyzers plus the additional list of features shown in Table 1. This includes high-power (multiple voltage levels to 200 W) TS parameter calculation and impedance measurements, multiple-voltage level AC/DC compression testing, speaker linearity testing, DC bias testing, and multiple-voltage level box compression testing. The Woofer Tester Pro package comes in a similar hardware package as the Speaker Tester analyzer, seen in Photo 2, and ships with the following:
• The test unit
• CD-ROM with software
• 2 Measurement microphones (Behringer ECM-8000) and cables
• 1 USB A/B Cable
• 2 RCA Y-Cables
• 1 10-Ω, 1-W Calibration resistor
• 1 0.5-Ω, 10-W Current sense resistor
• Low-power banana/alligator test leads
• Downloadable user guide
• Free software upgrades and support
Hardware features for the Woofer Tester Pro analyzer include high-power port for testing up to 200 Wrms, dual XLR microphone inputs, low-level line input and output, high-level amplifier voltage sensing, high-level amplifier current sensing, internal software controlled source switching, can self-powered using a 5-V wall wart or a USB port, and a physical package the same size at the Speaker Tester analyzer, 6" × 4.25" × 2.25".
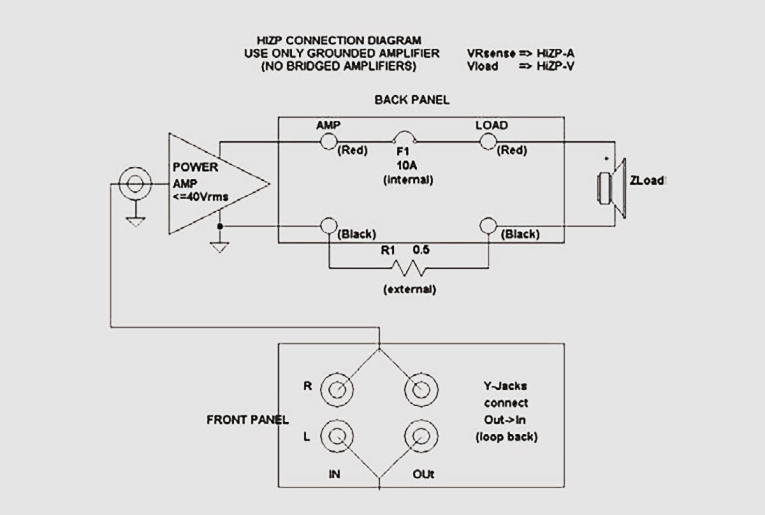
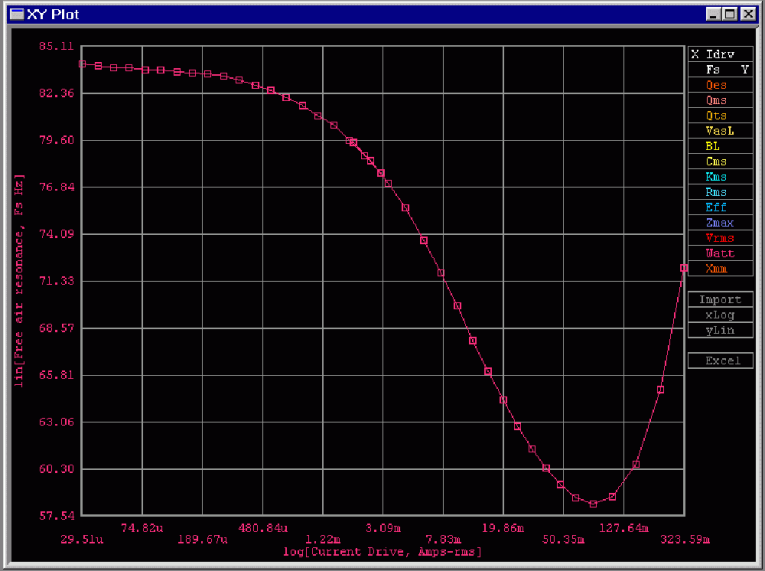
Measuring and quantifying Thiele-Small and box tuning data at higher power levels is a major step in designing higher-quality speakers. The high-power impedance and phase test port extends the Woofer Tester 2’s small signal milli-amp level tests to the multi-ampere high Xmax level where many drivers begin to distort and fail. The high-voltage setup diagram is shown in Figure 10, with a graph displayed in Figure 11 that shows the effect of drive current level changes on the small signal resonance (Fs).

A careful examination of the AC and DC results will often show that the suspension mechanical spring constant (inverse of compliance) significantly decreases as the AC test signal level increases. This effect is much larger than the static changes seen in the DC offset test. Cms (suspension compliance) is strongly dependent on break-in and drive level. The underlying mechanism is a function of how the molecular bonds in driver parts (surround and spider) respond to these conditions as the suspension mechanically loosens with hard use (break-in), environmental conditions (temperature) changes, and self heating due to mechanical energy loss (drive level).
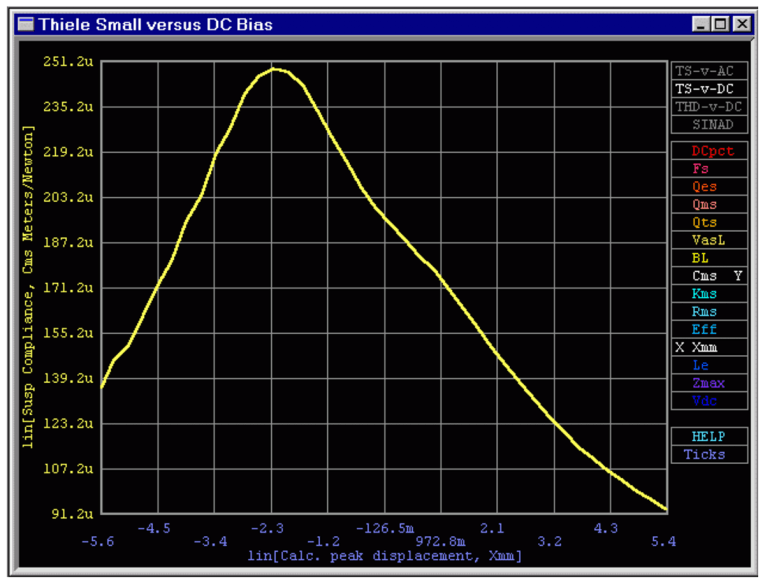
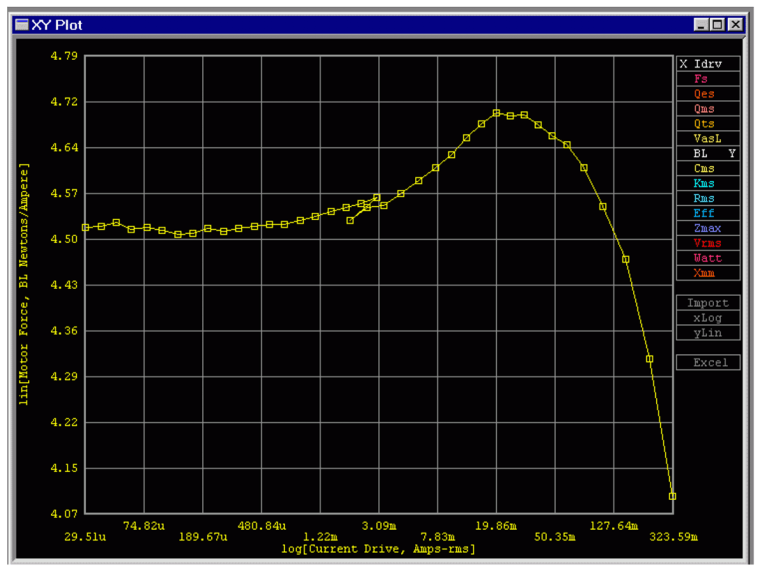
The Woofer Tester Pro can also measure T/S models while stepping through DC bias or AC drive levels. DC offset testing reveals suspension and motor mechanical offsets. See Figure 12 for a DC Cms vs. Excursion curve and Figure 13 for a DC Bl vs. Excursion curve. The AC drive levels provide compression modeling information.
See Figure 14 for an AC Bl vs. Excursion curve. The XY plot tool compares any parameter pair. Setting up the Speaker Tester or Woofer Tester Pro is similar, a calibration procedure is performed using the 10-Ω resistor and following the instructions in the software calibration procedure. Once calibration is complete, you can be making an impedance measurement on a speaker in a few minutes and an SPL measurement shortly thereafter factoring in the time it takes to connect cables and setup an amp and microphone. I was up and running with the S & L Woofer Tester Pro analyzer in about 30 minutes. Woofer Tester Pro is priced at $999.95. For more on this line of loudspeaker analyzers, visit the Smith & Larson website at www.woofertester.com. VC
This article was originally published in Voice Coil, March 2012