Unfortunately, this wireless connection introduces new challenges and issues that are not present in a classic wired connection. For manufacturers and designers of these modern audio devices, it is imperative that audio test and measurement solutions overcome these issues and provide accurate and reliable results.
Multi-Tone Testing
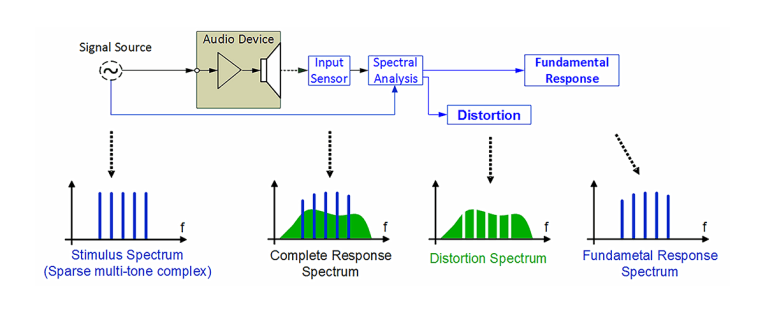
Multi-tone testing, which has been around for many years, starts with the generation of a sparse stimulus consisting of multiple tones, which will be expanded upon later in the article. The response is then captured and analyzed. The post-processing includes the separation of the bins containing energy corresponding to excited frequencies of the stimulus. The remaining bins contain the audio system’s distortion plus all noise. This process is illustrated in Figure 1.
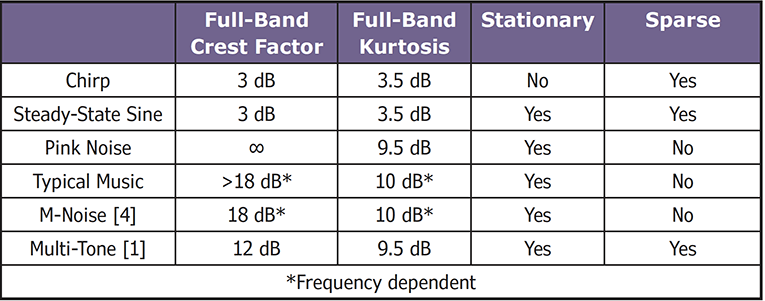
The multi-tone stimulus, such as defined by IEC 60268-21[1], consists of three or more tones, each at a unique and fixed frequency. As seen in Table 1, the crest factor for the multi-tone signal is much larger than the sine wave stimuli. In order to compare signals, crest factor, or kurtosis, which is a measure of the probability of any given data point being very close to the mean value vs. very far away from the mean, can be used. In both cases, a higher value means that the signal energy is more strongly concentrated around the mean and less at the peaks. However, kurtosis is preferred to crest factor because it provides similar information, but is a more robust statistical characteristic. This is illustrated in Table 1, where pink noise theoretically has an infinite crest factor.
In real systems, there is always an upper bound. However, the crest factor of a real system is less reliable because it is dependent on the peak value of the analyzed signal, which may be changing over time and could be different depending on the length of the captured signal. When comparing kurtosis values and stationarity, the multi-tone stimulus is very similar to pink noise.
The pseudo-randomness of the multi-tone stimulus is also important. For a noise-like signal, the phase of the frequency components should be randomized. However, the exact properties are based on a few input (seed) parameters, which ensures that the exact stimulus can always be repeated, leading to reproducible and comparable measurement results. The signal is also flexible depending on the particular measurement application.
The stimulus is usually defined by a frequency range with corresponding amplitude and density, or resolution of excited bins, with, for example, the unit tones per octave. Frequency dependent amplitude shaping can also be applied so that, for example, it has the spectrum of typical program material as defined in IEC 60268-21.
Advantages
As previously discussed, the sparse spectrum of the multi-tone stimulus makes it possible to separate fundamental components from distortion and noise components. Therefore, both the fundamental frequency response as well as a comprehensive distortion evaluation of the audio device can be extracted. This distortion measurement includes both harmonics and intermodulations and can be thought of as a distortion “fingerprint.”
When applied over a sufficiently wide frequency range, with a sufficient density (e.g., ≥ 10 tones per octave), and with enough amplitude (large signal domain), this stimulus activates all transducer nonlinearities, causes typical heating and force convection cooling and activates DSP protection features (limiter, compressor, etc.), if present.
In the end, the multi-tone measurement gives some great practical benefits. It can be used to quickly evaluate both an audio device’s fundamental and distortion responses in the same measurement and can also be used in long-term power and life testing. When used to compare and benchmark different audio devices, it gives more realistic and complete results than through sine wave testing alone. Multitone testing is also recommended for several aspects of IEC 60268-21 including rating maximum SPL, 100- hour testing, and input calibration.
Disadvantages
The comprehensive distortion evaluation of the multi-tone measurement gives a distortion curve in which the individual components cannot be separated. This means contributions from harmonics cannot be differentiated from intermodulations. Likewise, even-order and odd-order distortion components cannot be distinguished, so there is no indication of whether the nonlinearities are symmetrical or asymmetrical.
Finally, the multi-tone measurement is an energy-based measurement. Therefore, it is not very sensitive for impulsive distortion, also known as rub and buzz. For sensitive impulsive distortion detection, time domain analysis is recommended [2].
Wireless Multi-Tone Testing
While the benefits of multi-tone testing are apparent, testing modern audio devices with a wireless connection generates several additional issues that need to be overcome for accurate results. One issue found in a wireless connection that is not present in a classic analog connection is a larger latency or delay.
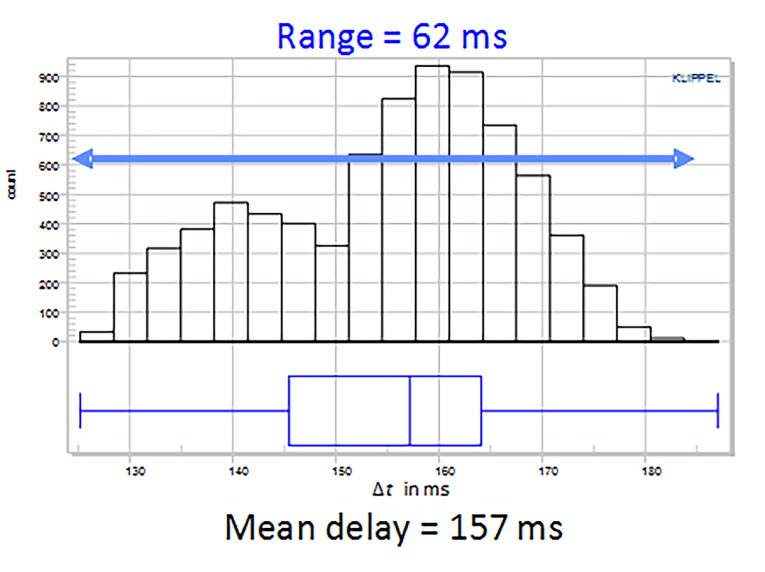
Depending on the specific type of wireless connection and the total setup, delays could be larger than 0.5 seconds. And while a constant and stable delay would be easier to deal with, the delay of wireless connections can vary significantly. Marian Liebig previously investigated the delay of a Bluetooth audio connection after 7,800 re-initialization processes, with the results shown in Figure 2 [3]. With a mean delay of 157 ms, the delay has a range of 62 ms, which corresponds to an acoustic delay with a range of more than 21 meters.
Another issue is sampling jitter, which is generated by a mismatch between the sampling rates of the audio device and the measurement device(s). This causes more severe problems for multi-tone testing than delay issues. This same issue can sometimes be seen when testing an audio device using an analog connection if the stimulus generator and the analyzer capturing the response do not share a common clock and are not completely synchronized.
The practical consequence is a frequency transformation of signals, leading to the response being either slightly shorter or longer than the stimulus. If the response is shorter than the stimulus, the response contains higher frequencies (shift upward). Likewise, if the response is longer than the stimulus, the response contains lower frequencies (shift downwards). This leads to a non-coherent relationship between stimulus and response that rises with frequency, degrading the accuracy of the measurement results.
This dynamic frequency transformation is a frequency modulation similar to the Doppler effect but more random. While this generates distortion, it only has a minor effect on perceptual audio quality, unlike amplitude modulation, which may cause fluctuations and roughness [5].
Although these effects are less perceptually relevant, they can cover up the more critical distortions of an audio device if the measurement system does not compensate for them. There is a lower impact on the fundamental frequency response but a high impact on the distortion and phase measurements, which are especially corrupted at high frequencies (≥ 1 kHz).
Solutions
Dealing with delay is not a new problem in audio measurements. For example, acoustic delay, dependent on the distance between the audio device and the microphone, must be considered. However, the delays in a wireless system can be much longer or vary much more than normal electrical or acoustical delays. In general, there are a few conventional ways to deal with long and/or varying delays.
The first is using a pre-loop, or an iteration of the stimulus, before the actual stimulus that is used to capture the response. If the stimulus length is longer than the longest expected delay, then a single pre-loop is sufficient. If the stimulus is very short or the delay is very long, more pre-loops can be added. Klippel’s R&D multi-tone measurement module MTON, like most Klippel modules, allows for the addition of pre-loops.
Other common methods of overcoming these delays, which are faster and may be required for production line testing, include finding the energy peak in the signal’s impulse response or using a synchronization signal such as Klippel’s External Synchronization (SYN) software add-on for use with Klippel’s QC (end-of-line) testing suite [3].
Sampling jitter is also not new in the context of audio because it is inherently present in all audio systems that incorporate a clocked device such as an analog-to-digital or digital-to-analog converter. However, these effects are usually negligible when assessing the audio quality of most complete electroacoustic systems with a wired connection.
However, when using a wireless connection, these effects can become much more severe and may corrupt measurement results. It is good practice to avoid long measurements, because the coherence between the stimulus and the response usually becomes worse over time. Also, averaging should be avoided because the sampling jitter is changing over time, meaning that it is unlikely that consecutive responses will have the exact same clock relationship and thus sampling jitter effects. However, even if long measurements and averaging are avoided, the results still may not be accurate.
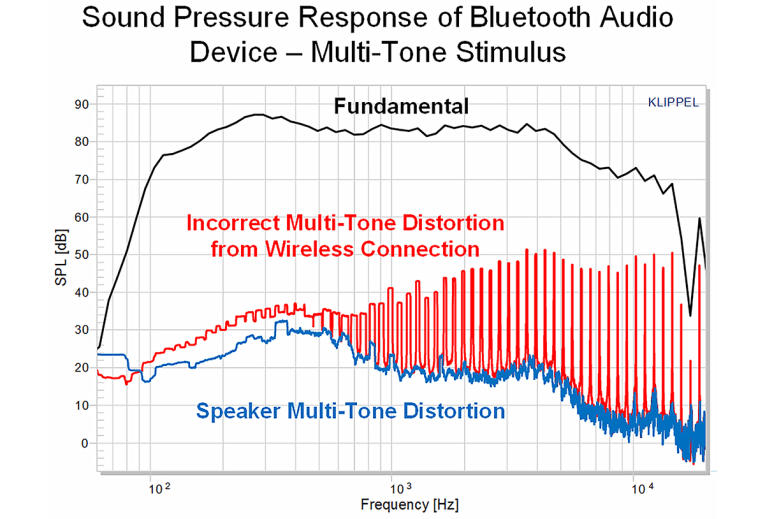
A more robust technique to reliably and accurately overcome sampling jitter effects is needed. Klippel’s MTON solves this by implementing a “Clock Drift Tolerance” feature. By activating this, the fundamental components, which undergo a smearing effect due to the sampling jitter, can be correctly identified and separated from the distortion components to provide accurate fundamental frequency and total distortion responses. Figure 3 shows differently processed distortion curves of multi-tone measurements using MTON on a Bluetooth audio device over a wireless connection. The red curve did not compensate for the sampling jitter, and the frequency modulation caused by the wireless connection is interpreted as distortion. The blue curve used the “Clock Drift Tolerance,” correctly identified the dominant distortions generated by the loudspeaker in the audio device, and is indistinguishable from the audio device’s distortion measured with a wired (analog cable) input connection.
Conclusion
Multi-tone testing has many advantages and is a fast and powerful tool for evaluating overall performance and audio quality. And because of the increasingly wireless nature of modern audio devices, audio test and measurement solutions must be able to reliably overcome the issues generated by a wireless connection. Klippel’s MTON method can quickly and accurately assess the fundamental and distortion responses of an audio device, even if a wireless connection with long and varying delay and sampling jitter is used.
Klippel has a wealth of freely available information regarding multi-tone testing, testing over a wireless connection, benchmarking, and much more. See the Resources for several relevant links including application notes, web-seminars, and measurement modules. aX
This article was originally published in audioXpress, December 2020.
About the Author
Andrew Taylor received his bachelor’s degree in electrical engineering at the University of Kansas in Lawrence, KS in 2015. As he finished his master’s in electrical engineering with a concentration in musical acoustics and signal processing at the University of Rochester in Rochester, NY, he interned at Klippel GmbH in 2016. He has been a full-time employee at Klippel since 2017, where he now splits time between audio analyzer hardware development and technical writing and content creation.
References
[1] IEC 60268-21, “Sound System Equipment—Part 21: Acoustical (Output Based) Measurements,” International Electrotechnical Commission (IEC), 2018.
[2] W. Klippel, “Measurement of Impulsive Distortion, Rub and Buzz and other Disturbances,“ presented at the 114th Convention of the Audio Engineering Society, March 2003, preprint 5734.
[3] M. Liebig, “Challenges of Testing Mobile Devices and Mobile Testing,” Voice Coil, January 2017.
[4] R. Schwenke, “A New Signal for Measuring Loudspeaker Maximum Linear SPL”, SMPTE 2019 Annual Technical Conference, Los Angeles, October 2019 (submitted).
[5] E. Zwicker and H. Fastl, Psychoacoustics—Facts and Models, Springer, Berlin, 1999, ISBN 3-540-65063-6
Resources
AN72, Testing Wireless Audio Devices with Klippel R&D System, Klippel application note,
AN73, QC Headphone Testing, Klippel application note,
AN76, QC Testing of Wireless Audio Devices, Klippel application note,
www.klippel.de/know-how/literature/application-notes.html
External Synchronization (SYN) Option for Klippel QC System,
www.klippel.de/products/qc-system/modules/syn-externalsynchronization.html
Klippel QC System, www.klippel.de/products/qc-system.html
Klippel GmbH, Multi-Tone Distortion,
www.klippel.de/know-how/measurements/nonlinear-distortion/multitone-distortion.html
Mutli-Tone Distortion (MTD) Option for Klippel QC System,
www.klippel.de/products/qc-system/modules/mtd-multi-tonedistortion.html
Multi-Tone Measurement (MTON) for Klippel R&D System,
www.klippel.de/products/rd-system/modules/mton-multi-tone-measurement.html
KLIPPEL LIVE – Web-Seminars:
Session #5: Maximum SPL – Giving This Value Meaning, Acoustical Measurement of Sound System Equipment according to IEC 60268-21
www.klippel.de/know-how/education/klippel-live-web-seminars/iec-60268-21.html
Session #7: Amplitude Compression – Less Output at Higher Amplitudes, Acoustical Measurement of Sound System Equipment according to IEC 60268-21
www.klippel.de/know-how/education/klippel-live-web-seminars/iec-60268-21.html
Session #11: Pitfalls in Testing Wireless Audio Devices, Acoustical Measurement of Sound System Equipment according to IEC 60268-21
www.klippel.de/know-how/education/klippel-live-web-seminars/iec-60268-21.html
Session #12: Benchmarking of Audio Products Under Standard Conditions, Acoustical Measurement of Sound System Equipment according to IEC 60268-21
www.klippel.de/know-how/education/klippel-live-web-seminars/iec-60268-21.html