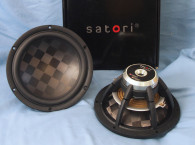
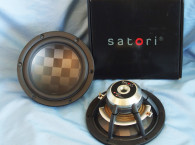
This Test Bench sample, the 12CXA400Nd, came from pro sound OEM driver manufacturer Acustica Beyma. Acustica Beyma has an extensive line of pro sound coaxial drivers, which now includes the 12CXA400Nd 12” coaxial driver. Applications for 12” drivers include floor monitors for stage use, studio monitors, or any requirement where baffle space is limited.
is primarily provided by the motor mass
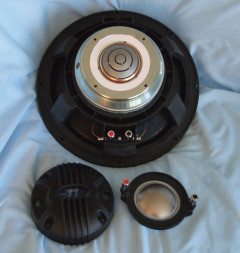
and the black finned compression
driver cover.
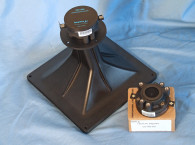
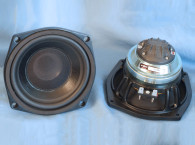
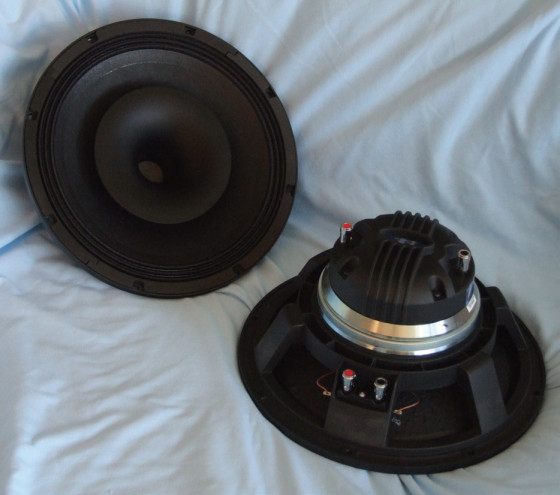
The woofer motor utilizes a 155-mm diameter neodymium ring sandwiched between a polished and shaped front plate that provides the gap for the woofer voice coil and a polished and shaped back plate that provides the gap for the compression driver. Attached to the front of the motor is a short 155-mm diameter conical injection molded 60° conical horn that completes the compression driver. As with most pro sound compression drivers, the diaphragm is field replaceable.
The 12CXA400Nd’s cone assembly includes a curvilinear waterproof coated paper cone suspended by a coated-cloth M-shaped three-roll surround. Coupling the cone to the driver motor is a 101.6-mm (4”) diameter voice coil wound with copper wire on a nonconducting former terminated to a pair of color-coded chrome push terminals. For the high-frequency compression driver, Acustica Beyma incorporated a titanium/mylar composite diaphragm coupled to a 72.2-mm (2.8”) voice coil wound with aluminum wire.
Both the woofer and the compression driver motor use shorting rings (Faraday shields) for lowering inductance and extending the high-frequency range. The compression driver uses a copper shorting device.
To begin testing, I started with the woofer half of this coaxial driver. First, I used the LinearX LMS and VIBox to produce voltage and admittance (current) curves with the driver clamped to a rigid test fixture in free air at 1, 3, 6, 10, 15, 20, and 25 V. The LMS oscillator is turned on for a progressively increasing time period between sweeps to keep the driver heated as close to the third thermal time constant as possible (from 10–30 s between sweeps, depending on the voltage level).
Following the established Test Bench test protocol, I no longer use a single added mass measurement. Instead, I use actual measured cone assembly weight, which Acustica Beyma provided. The 12CXA400Nd woofer motor stayed fairly linear during the test sequence so I did not discard any of the curves.
Next, I post-processed the 12 550-point stepped since wave sweeps for each sample and divided the voltage curves by the current curves to derive impedance curves that were then phase calculated. I imported them along with the accompanying voltage curves to the LEAP 5 Enclosure Shop software. Because most Thiele-Small (T-S) parameter data provided by OEM manufacturers is produced using either a standard model or the LEAP 4 TSL model, I used the 1-V free-air curves to additionally create a LEAP 4 TSL model.
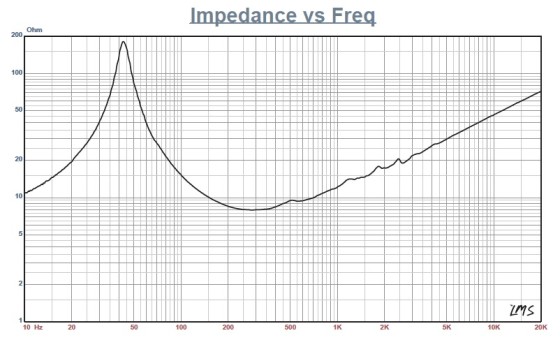
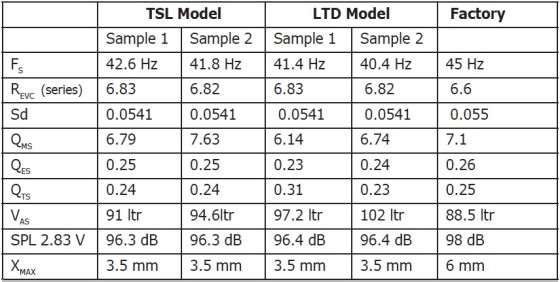
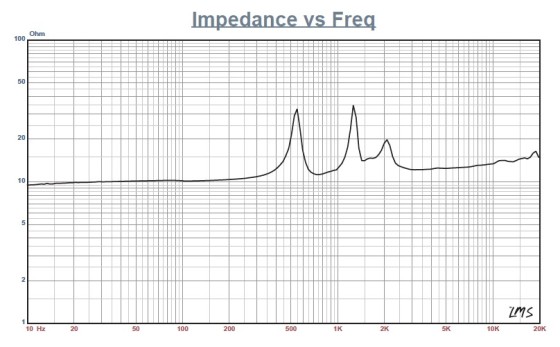
I selected the complete data set, the LTD model’s multiple voltage impedance curves, and the TSL model’s 1-V impedance curves in the transducer derivation menu in LEAP 5. Then, I created the parameters for the computer box simulations. Figure 1 shows the woofer’s 1-V free-air impedance curve. Figure 2 shows the compression driver’s impedance curve. Table 1 compares the LEAP 5 LTD and TSL data and factory parameters for both Acustica Beyma 12CXA400Nd samples.
Parameter measurement results for the 12CXA400Nd were close to the factory data except for some deviation in the sensitivity and XMAX, but this was due to different methodology. The sensitivity numbers that I publish are the calculated mid-band sensitivity that is a result of the T-S parameter generation process. Acustica Beyma uses a physical sound pressure level (SPL) measurement that is 1 W/1 m, averaged between 1 to 7 kHz. The XMAX number I publish is the actual physical XMAX, which is (voice coil length – gap height)/2.
Acustica Beyma adds in a fringe field component. The formula it uses is [(voice coil length – gap height)/2 + (gap height/3.5)]. Since everything looked good, I used the LEAP LTD parameters for Sample 1 to set up two computer enclosure simulations. This produced two vented alignments, a 0.55-ft3 QB3 alignment tuned to 67 Hz with 15% fiberglass fill material, and an Extended Bass Shelf (EBS) vented alignment tuned to 41 Hz, also with 15% fiberglass fill material.
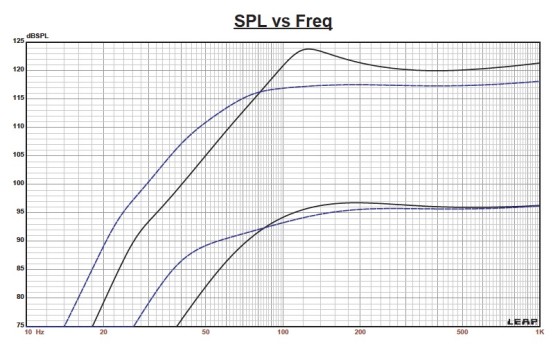
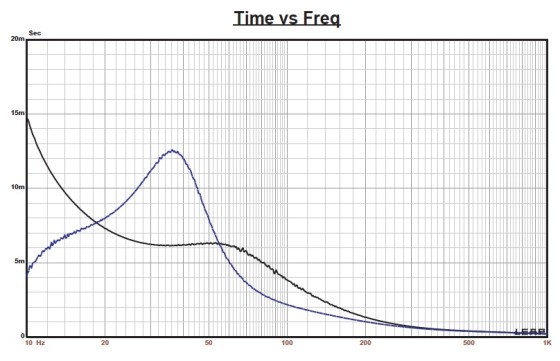
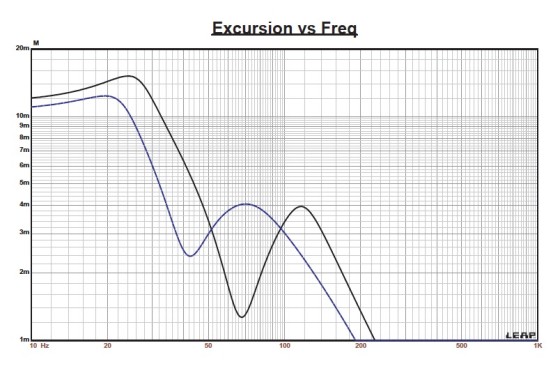
Figure 3 shows the 12CXA400Nd woofer’s results in the two vented boxes at 2.83 V and at a voltage level sufficiently high enough to increase cone excursion to 44 mm (XMAX + 15%). This produced a F3 frequency of 95.5 Hz (–6 dB = 75.5 Hz) for the 0.55 ft3 box tuned to 67 Hz and a –3 dB = 88 Hz (–6 dB = 52.6 Hz) for the 1.5-ft3 box EBS vented simulation tuned to 41 Hz. Increasing the voltage input to the simulations until the maximum linear cone excursion (XMAX + 15%) resulted in 124 dB at 80 V for the QB3 enclosure simulation and 117.5 dB at the same 43-V input. Figure 4 shows the 2.83-V group delay curves. Figure 5 shows the 80-V/43-V excursion curves.
KLIPPEL analysis for the 12CXA400Nd produced the Bl(X), KMS(X) and Bl and KMS symmetry range plots shown in Figures 6–9. (Our analyzer is provided courtesy of KLIPPEL. Pat Turnmire of Redrock Acoustics performs the analysis.)
The 12CXA400Nd woofer’s Bl(X) curve is moderately broad, and mostly symmetrical with some offset (see Figure 6).The Bl symmetry plot has a 0.35-mm forward (coil-out) at the rest position and only increases to 0.48 mm at the physical XMAX of the driver, just slightly out of exact magnetic center and certainly within QC tolerance (see Figure 7).
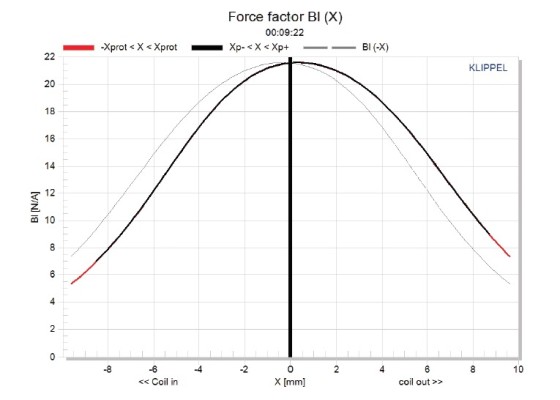
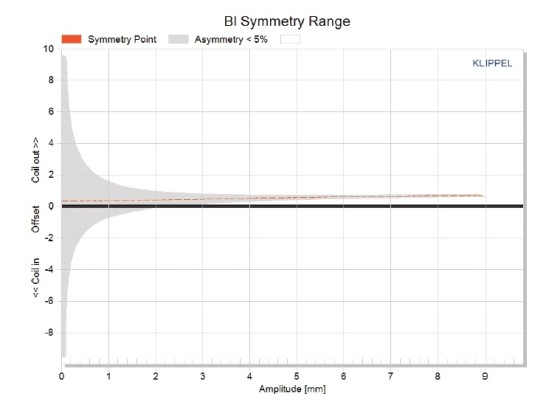
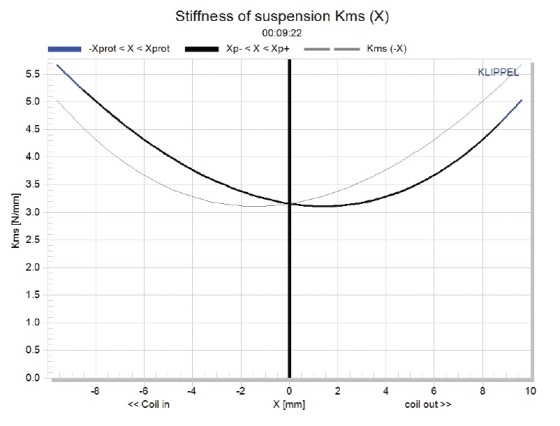

Figure 8 and Figure 9 shown the 12CXA400Nd’s KMS(X) and KMS symmetry range curves. The KMS(X) curve is also quite symmetrical in both directions, with a relatively small amount of coil-out (forward) offset (see Figure 8). Looking at the KMS symmetry curve shown in Figure 9, the offset is 1.4 mm at the zero rest position. It decreases to 0.48 mm at the physical XMAX, with not a lot of variance throughout its operating range.
The 12CXA400Nd’s displacement limiting numbers, which were calculated by the Klippel analyzer, were XBl at 82% (Bl decreasing to 82% of its maximum value) was 3.6 mm. For crossover (XC) at 75% (compliance decreasing to 75% of its maximum value), it was 4.8 mm. For the 12CXA400Nd, the Bl is the most limiting factor at the prescribed distortion level of 10%. However, 10% may be somewhat conservative given the relative difficulty of subjectively perceiving total harmonic distortion (THD). If we apply the 20% distortion criteria with Bl decreasing to 70% and compliance decreasing to 50%, then the numbers are XBl = 4. 8mm and XC = >7.85 mm.
Figure 10 shows the inductance curve L(X) for the coaxial woofer. Inductance will typically increase in the rear direction from the zero rest position as the voice coil covers more pole area unless the driver incorporates a shorting ring.
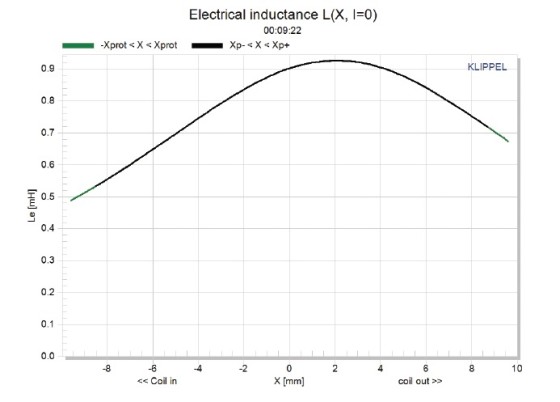
Since the 12CXA400Nd incorporates a Faraday shield (shorting ring) in the motor assembly, the typical inductance diminishes in the coil-in direction of motion. From XMAXIN to XMAXOUT, the inductive change is small between 0.01 to 0.16 mH.
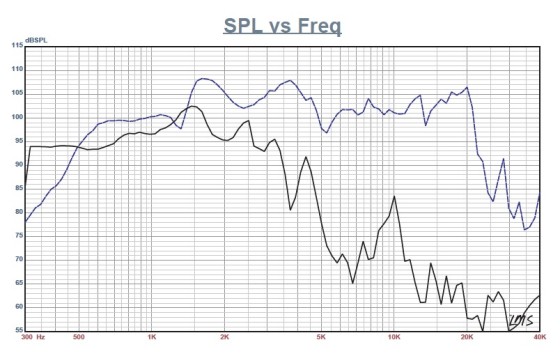
I mounted the 12CXA400Nd in an enclosure which had a 15” × 16” baffle filled with foam damping material. I used a 100-point LMS gated sine wave sweep to measure the woofer and the compression driver/horn on- and offaxis frequency response from 300 Hz to 40 kHz at 2.83 V/1 m a. Figure 11 shows the 12CXA400Nd woofer’s on-axis response along with the compression driver/horn’s on-axis response. The woofer has a rising response out to a 5-dB peak at 1.5 kHz followed by a typical second-order low-pass roll-off.
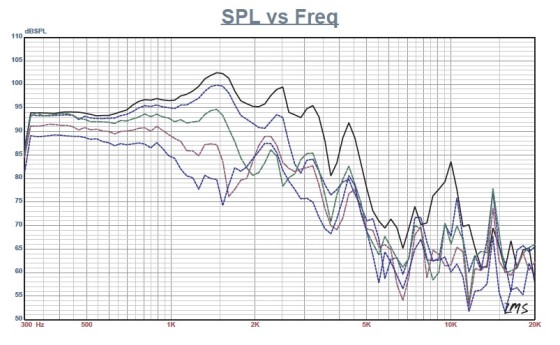
For the compression driver/horn, the response is ±5.5 dB from 1.5 kHz out to 20 kHz. Figure 12 shows the woofer’s on- and off-axis frequency response at 0°, 15°, 30°, 45°, and 60°. The –3 dB at 30° with respect to the on-axis curve occurs at 1 kHz, which makes 1 to 1.4 kHz a reasonable crossover range. However, Acustica Beyma recommends a 1.5 kHz or higher (second-order) crossover frequency for the compression driver.
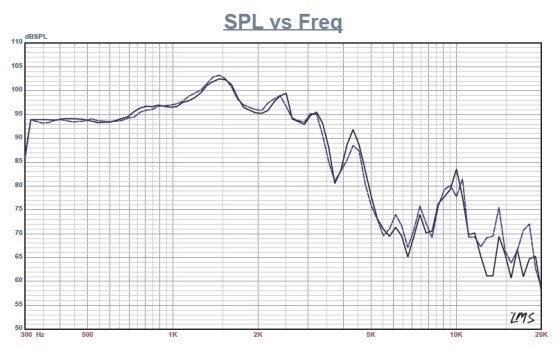
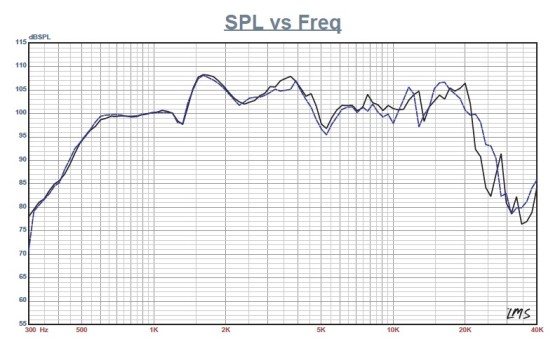
And last, Figure 13 shows the 12CXA400Nd woofer’s two-sample SPL comparisons, which both samples obviously closely matched. For the compression driver with the conical 60° horn, Figure 14 shows the on- and off-axis horizontal frequency response out to 60°. Figure 15 shows the compression driver/horn’s two-sample SPL comparison, which is within 1 to 2 dB throughout the entire
frequency range.
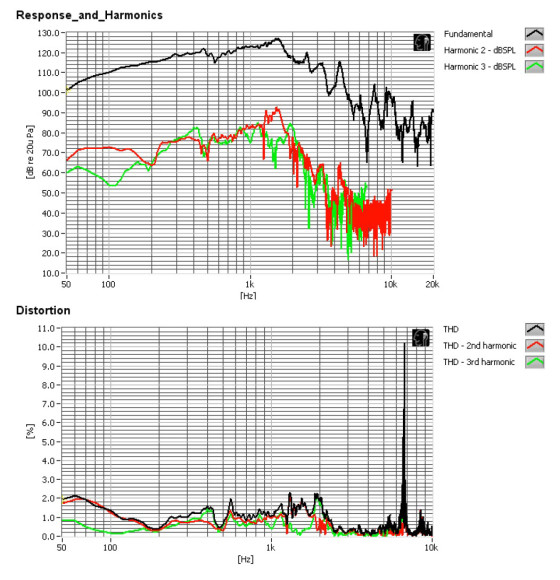
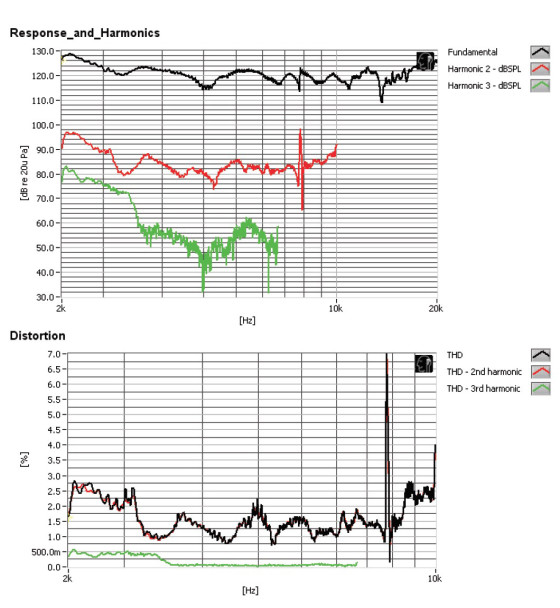
I used the Listen SoundCheck analyzer and SC-1 microphone (courtesy of Listen) to measure distortion and generate time-frequency plots. To set up the distortion measurement, I mounted the driver rigidly in free air. Then, I used a noise stimulus to set the SPL to 104 dB at 1 m. (SoundCheck has a software generator and a SPL meter as two of its utilities.) I measured the distortion with the Listen microphone placed 10 cm from the dust cap/horn mouth. Figure 16 shows the woofer’s distortion curves (7.75 V). Figure 17 shows the compression driver’s distortion curves (3.24 V).

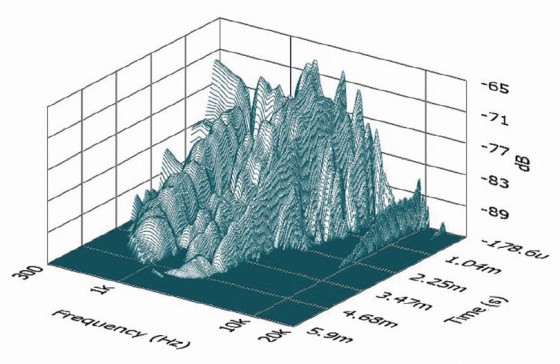
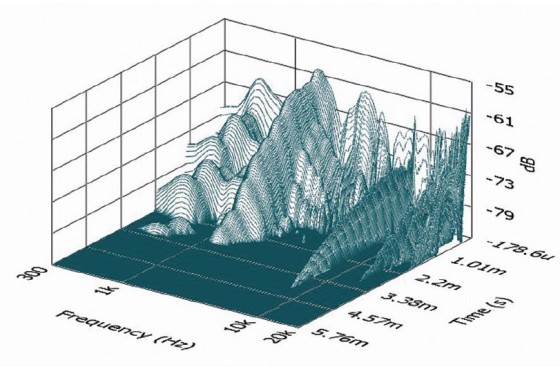
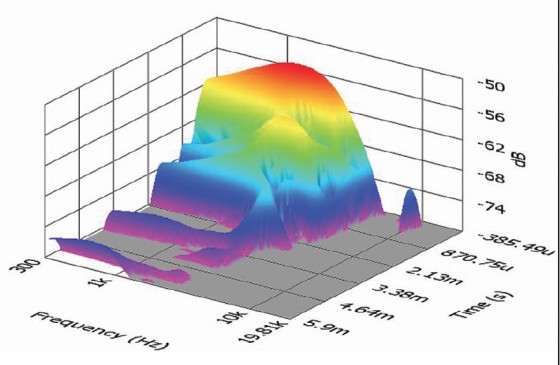
Next, I set up SoundCheck to produce a 2.83 V/1 m impulse response for the woofer and the compression driver. I imported the data into Listen’s SoundMap time frequency software. Figure 18 shows the 12CXA400Nd woofer’s resulting cumulative spectral decay (CSD) waterfall plot. Figure 19 shows the compression driver’s CSD waterfall plot. For the final SoundCheck measurements, Figure 20 shows the woofer’s Wigner-Ville logarithmic surface map. Figure 21 shows the compression driver’s short-time Fourier transform (STFT).
The 12CXA400Nd is a well-designed coaxial driver for pro sound applications (e.g., stage or studio monitors).
For more information, visit www.beyma.com
waterfall plot.

This article was originally published in Voice Coil, October 2014