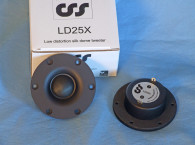
The transducer, actually transducers, I examined in This Test Bench were the new Wavecor TW030WA13/14 (see Photo 1). The A13 is the 4-Ω version, while the A14 is the 8-Ω version. They are the latest addition to Wavecor’s 30-mm tweeter lineup. Voice Coil’s Test Bench featured the original full rear cavity version of this 30-mm tweeter, the TW030WA08, in Voice Coil December 2009; the non-cavity low-resonance version, the TW030WA09, in Voice Coil August 2012; and the TW030WA12, the 30-mm waveguide version in the Voice Coil January 2015 issue.
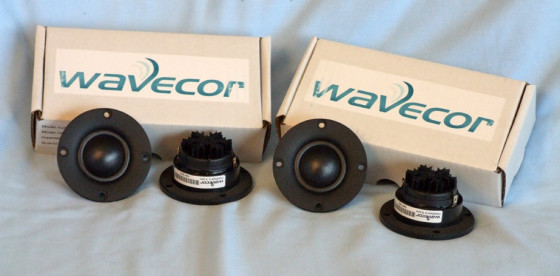
The Wavecor TW030WA13/14 tweeters offer a 30-mm wide surround precision-coated cloth diaphragm optimized for high-frequency cutoff above 20 kHz, internal chambers below the dome and surround, copper-clad aluminum voice coil winding with a vented voice coil former, flexible lead wires for large excursions with crossovers below 3 kHz, and black anodized motor parts for enhanced cooling including a rear-mounted aluminum heatsink, a copper-clad pole piece (shorting ring), plus gold-plated terminals.
I used the LinearX LMS analyzer to produce the 300-point impedance sweep for the TW030WA13/14 (see Figure 1). The resonance for the 4-Ω and the 8-Ω versions occur at a moderately low 702 Hz. The TW030WA13 4-Ω version’s factory quoted Qts is 1.01. The Qts is 1.17 for the 8-Ω model. DVM measured direct current resistance (DCR) for the 4-Ω version was 3.44 Ω with a minimum impedance above resonance of 3.68 Ω at 3.68 kHz. For the TW030WA14, DCR = 6.35 with minimum impedance occurring at 3 kHz at 6.71 Ω.

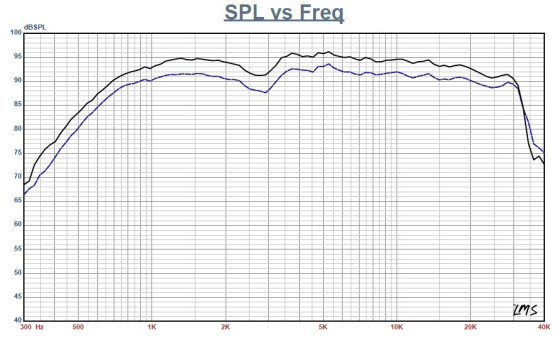


Next, I recess mounted the Wavecor tweeters in an enclosure with a baffle area of 14” × 7” and measured the on- and off-axis frequency response with a 100-point gated sine wave sweep at 2.83 V/1 m. Figure 2 shows the on-axis responses for both the TW030WA13 and the TW030WA14. They exhibited a ±2.5 dB response from 750 Hz to 23 kHz. If you look at the operating range from 3 kHz to 20 kHz, it would be a very flat ±1.5 dB for both tweeters.
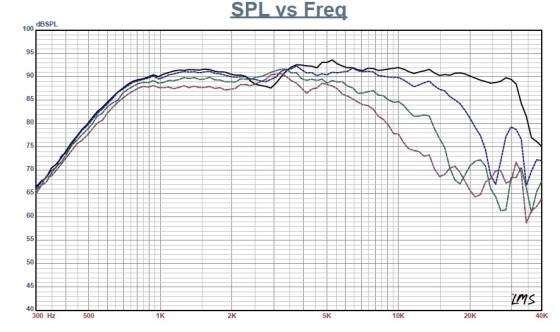
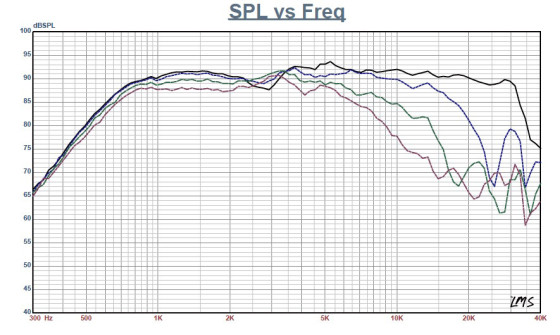
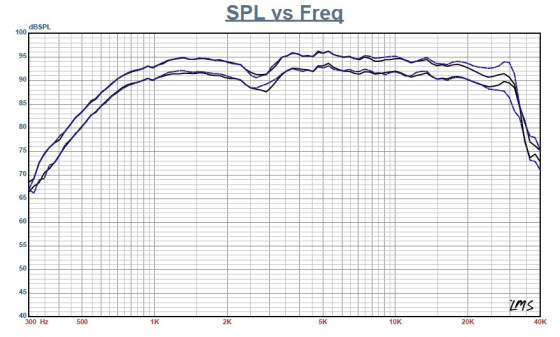
Figure 3 depicts the TW030WA13’s on- and off axis response, with the off-axis curves normalized to the on-axis response shown in Figure 4. The same curves for the TW030WA14 8-Ω version are shown in Figure 5 and Figure 6, respectively. The two-sample SPL comparison for the 4-Ω TW030A13 and the 8-Ω TW030WA14 are shown in Figure 7, indicating that both sets of samples were closely matched.
Next, I used the Listen SoundCheck software and SoundConnect analyzer and SCM 0.25” microphone to measure the impulse response with the tweeter recess mounted on the test baffle. Because the two versions of this tweeter have almost identical responses, I only used the 4-Ω version, the TW030WA13, for this process and for the distortion measurement. Importing this data into the Listen SoundMap software produced the CSD (waterfall) plot shown in Figure 8. Figure 9 depicts the Short-Time Fourier Transform (STFT) displayed as a color-variegated surface plot.
Then, I used a pink noise stimulus to set the SPL to 94 dB (4.04 V for the 4-Ω version) at 1 m and measured the second and third harmonic distortion at 10 cm (see Figure 10). Wavecor has fielded another nice high-end product for the home audio or studio monitor markets.
For more information, visit www.wavecor.com.


This article was originally published in Voice Coil, April 2015